Friday, January 4, 2013

Exporting talent: the Rugby World Cup players

I'm uploading a few old but interesting Rugby World Cup visualisations...

National pride in sport

I'm intrigued by the idea of sports players acting like avatars for the people of a region or country, representing them in competitions with other regions. But what if the player is very evidently not from that region or country?
A large number of Rugby World Cup 2011 players 'migrated' to play for another country in the championship. 

How to read this chart:
At the left are the countries which players played for. At the right are the countries where they were born. The width of the ribbons shows how many players moved between those two countries.

  • New Zealand appears as the biggest exporter of talent. There are large numbers of Pacific Islander players living in New Zealand who returned to their ancestral home to play - Samoa is highly visible.
  • Samoa, the USA and Italy are the biggest importers of talent. Samoan players are generally ethnic Samoans from families living in New Zealand. Italy had several ethnic Italians from Argentina. The USA's figures are inflated by American Samoa players, who are considered to be 'migrated', but it still imported seven other players born around the globe.
  • A famous migrant is Quade Cooper, the New Zealand-born Australian player, who was booed in New Zealand RWC games. Quade's success was particularly resented because it worked against his birthplace.
  • Many of the migrated players, like Quade, moved early in life to their adopted countries. But for others, citizenship will have been planned in time for the RWC. Zimbabwean Tendai 'Beast' Mtawarira has had challenges with eligibility to play for South Africa, luckily resolved in time for RWC 2011.
  • It's easy to understand the inflow from countries with little chance of participating. On the other hand, several participating countries have both an inflow and an outflow of players - most notably there is cross-flow between New Zealand and the Pacific Islands, but note also England and South Africa.
  • Blips in the data - the structure of the UK makes for interesting analysis. Both the UK and its constituent parts (Scotland, England, etc.) are considered countries. However, Northern Irish players play for a pan-Ireland team, regardless of citizenship (this makes for an interesting challenge of what to play when it's time for the national anthem!). The Northern Irish players are shown here as 'migrated' when, in fact, they are playing for their team: Ireland.

Technical details: I created this chart in javascript library Protovis.

Sunday, October 21, 2012

October windiest since cyclone year

People around New Zealand are being blasted by the windiest October in decades. 

October the windiest month

October is when New Zealand has most wind. In Auckland, the average windspeed is 12.3 metres per second through the year, but that reaches a peak of 13.4 metres per second in October.

Powerful source of historical data

New Zealand's many weather stations have recorded temperature, rain, gales and other weather phenomena since the mid-1800s. This rich source of data allows us to see changes in weather patterns over time.
New Zealand's many weather stations (grey) and, highlighted in red, the four stations examined below

1988: the year of Cyclone Bola

1988 stands out as a record year across New Zealand in terms of wind. That year, both Wellington and Invercargill had over 30 days of gales! Although the cyclone was in February and March 1988, October 1988 was still much windier than normal.

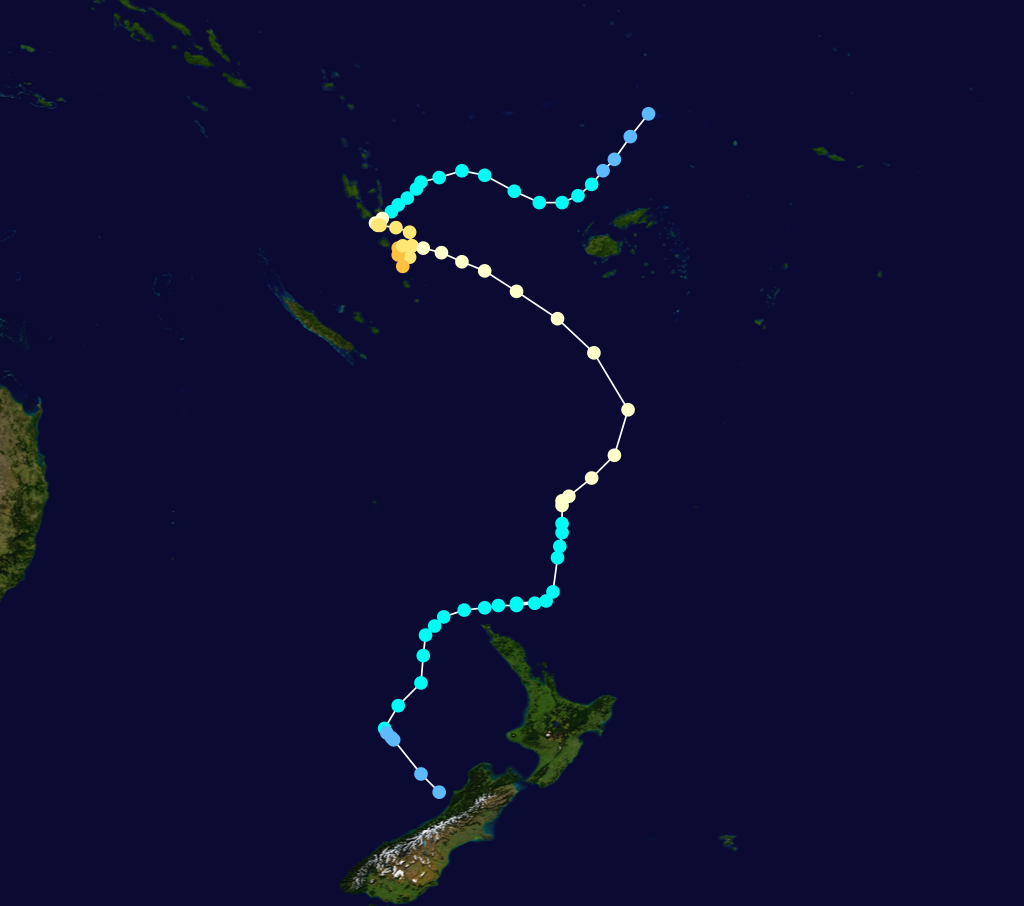
The path of Cyclone Bola

Record windspeeds recorded in this October in Auckland

The average windspeed at Auckland airport is 13.4 metres per second, but this October to date (up to 18th October) has averaged a whopping 16.7 metres per second. So if you've felt blown about - now you know why!

Blustery October in Christchurch, Wellington and Invercargill

This October has also been more than a little breezy in the rest of the country, but not the windiest on record.

Christchurch's windiest Octobers in 40 years of records:
  1. 1988 (17.4 m/s windspeed)
  2. 2007
  3. 1984
Wellington's windiest Octobers in 40 years of records:
  1. 1988 (25.5 m/s windspeed)
  2. 1991
  3. 1984
Invercargill's windiest Octobers in 40 years of records:
  1. 1988 (21.6 m/s windspeed)
  2. 1977
  3. 2008


Friday, September 7, 2012

New Zealand's Rollin Hard: infographic about drugs

I've been catching up on news and stats published while I was in Italy and I'm amazed that there wasn't more local news coverage of the United Nations' World Drug Report. This shows New Zealanders to be among the most prevalent illegal drug users in the world!


I'm belatedly making up for the shortage with my own analysis - pretty sobering stuff, eh? For more details on my methods, or just to tell me what you think, drop me a line.


Friday, February 17, 2012

What I learnt today

I LOVE learning stuff. And I've learnt a lot recently, which makes me happy.

A month ago I was inspired by Google's Matt Cutts who advocates trying something new for thirty days.  My 'something' was An App a Day.

I didn't make it through the thirty days (thank you to the clients who've given me plenty of work to keep me out of mischief!), but I did learn tonnes.  In fact, it feels like a tiny pebble rolling has started an avalanche - so many exciting avenues of discovery, so little time!

Documenting all my new ideas is not my strong point, but here goes.

I've been thinking of moving Babbling Wren onto a more single-minded platform dedicated to data viz, and thinking about how that site will look, feel and function is a lot of fun.  I get geekily excited when I see sites like Fuzzimo and Rivers End which have some beautifully textured, interactive elements.  I want my site to appeal to the senses too.  With that in mind, I've been looking at effects which evoke old worn, noisy, rough, scuffed surfaces.  Things which remind you of the textures of your childhood, or how it feels to pick up a paintbrush or a needle and thread.

Appliquéd letters seemed like a good place to start.  So today I developed my fledgling Illustrator skills thanks to a couple of Vectips tutorials.


The nice thing about this is that I can save the style in Illustrator and apply it to any text, with any typeface.  Clever, no?

Saturday, December 31, 2011

Trees Worth Knowing About

An infographic comparing the wise old men of the tree world. 
Detail of illustration of the world's oldest tree.
Detail of infographic
I spent my antipodean Christmas break in Northland - the remote and sparsely populated top chunk of NZ's North Island. I was delighted to discover not just gorgeous scenery but also some cultural gems there. 
Northland, New Zealand

Northland was a crucible of modern New Zealand; here the Declaration of Independence was signed, soon superseded by the controversial Treaty of Waitangi. Here Busby, Hobson, Clendon and Hone Heke battled to protect their interests with flags, contracts, and fire power. And here lives something more timeless than all of those famous warriors and diplomats: Tāne Mahuta, an ancient kauri tree and one of the oldest and largest living things on earth.


Seeing the virgin kauri forest is a moving experience. There is the smell of wet rainforest and the sound of a million tiny creatures fighting their corner of the ecosystem. A giant kauri is not only incomprehensibly vast, it is also smooth, with just a chaotic, spiky crown high above the ground. The towering giant gives an impression of serenity, but it is not thanks to a peaceful nature that kauri have survived since the Jurassic. They have five clever strategies to kick the young upstarts in the shins.

1.Bigger than the rest
Crown higher than canopy.
2.Unclimbable
Sheds lower branches as it grows, avoiding vines.
3.Shed skin to stay bug-free
Flaking bark defends from parasites.
4.Chemical warfare
Acidic litter from bark around base of tree releases other nutrients from clay, stopping other trees from getting them.
5.Scare off the bad bugs, share with the good ones
Acidity, waxes and phenols deter microorganisms which would otherwise rot the kauri, but symbiotic relationship with fungus mycorrhiza helps nutrient uptake, starving competitors.

Before my visit to Waipoua Forest, I was determined not to become a 'tree geek', but I'm afraid it's too late.  I'm in love with Tāne Mahuta and his contemporaries, and I thoroughly recommend you visit Northland.

Saturday, December 3, 2011

The 1376 Census of Sulmona (& Protovis Donut Chart)

Donut Chart
Data viz people love censuses.  They are a mirror for our nations to reflect upon ourselves.  There are lots of modern data viz examples using census data.  But no one seems to have analysed historic censuses.

Some of the earliest censuses which survive today began appearing in the 1200s and 1300s.  I've been enjoying Joseph & Frances Gies book, which explores what these early sources tell us about family life in the Middle Ages.  Since I used to live near Sulmona in central Italy, I had read about the rare Sulmona census of 1376 in Ezio Mattiocco's book.  Signore Mattiocco uses text, and the odd table, to explain the data.  Wouldn't it be great to see some of that visually?

The Gies don't mention the 1376 Sulmona census, so I thought I'd apply some of their analytic approaches to it in my data visualisation exploration.  

To get us started, here's a view of what land was used for in 1376.  The majority was ploughed, but a surprising amount is allocated to wine and hemp.


I created this chart in JavaScript / Protovis, but Blogger doesn't appear to support Protovis, so here's a static image instead.  In the original you can roll over each wedge to see the number of hectares represented.  Thanks to Nathan Yau's Visualize This for the tutorial.

Wednesday, November 30, 2011

NZ Unemployment Continues to Climb & LOESS curves

Today's data viz challenge has been using R (stats software) to build a chart of New Zealand's unemployment with a LOESS curve showing the big picture behind the fluctuating data points.  LOESS curves are clever, and R has a function for them, giving you a curving trend line in a way you just couldn't achieve with MS Excel.

Although the task in hand is charting up some data, I was surprised to see just how dramatic the unemployment story is - jobseeker numbers have almost quadrupled in the past three years!

Is this better or worse than other countries?  The mood of the nation doesn't seem as pessimistic as elsewhere, so perhaps others are even worse off.


Tuesday, November 29, 2011

Creating Step Charts in R

I'm determined to boost my programming skills - this looks like the only way to create truly customised data visualisation. So my weekend projects tend to consist of many hours tapping away at the keyboard until I get something I'm happy with.
Today I've created a chart showing the price of a postage stamp in New Zealand. Unlike most price-by-time charts, postage stamps suit step charts, because prices are fixed for long periods between step changes.
Now the chart below might not look like rocket science, but bear in mind that neither Excel nor Illustrator has a built-in step chart type, as Nathan Yau points out in his data viz book "Visualize This". So to create this in something like Excel, you would have to use some kind of work-around.
The downside is that to use the wider array of chart types available in R (free statistics software), you need to get your hands dirty with a wee bit of programming. Since that's what I'm trying to learn, it all works out quite nicely!

Sunday, May 29, 2011

Creative weekend projects: getting crafty

Project 1: The veggie garden for small spaces


Decking frame plus polythene sheet provides tray for bucket plant pots


Thanks to an Urban Pantry talk (highly recommended), I learnt a great tip for getting veggie results even in the cosy corner of my deck which I like to call my "garden".  Square buckets.  That's right, it's time to clear up the eclectic mix of terracotta urns and quaint milk pails.  We waste less space and less water if we pack our plants in cubically.  Well, maybe I won't get rid of the eclectic mix just yet - I get sentimental about my plants and their unusual collection of pots!  But I was determined to try out the environmentally friendly approach as well.
The buckets were cheap (much more so than plant pots) but the challenge was working out a tray to hold water beneath them.  My low-tech solution is a frame of decking timber and polythene sheet liner.
Buckets 10 @ $2.50 = $25
Polythene (much more than I needed) = $7
Decking timber (cut into the lengths I needed in the shop) = $6
Basic power drill to put it all together and drill holes in buckets = $40 (but who's counting?  It's about time I owned more power tools...)
So my pea seedlings are happy, I'm happy and kitty is certainly happy!


Project 2: Cute cushions!

Piping and ties on the left, and on the right, laboriously quilted by moi!
Some have bold pattens on one side and ties on the other 

I can never quite find the right level of quirky colourfulness in bought cushions.  Or if I do, they cost a fortune. I was convinced I could do a better job myself.  If I'd known how much work it would be, I might not have started!  My darling and very creative sister has been an invaluable tutor and partner in crime.
I now have four cushions pretty much finished and two to go.  I just need to finish before Ross' mum comes back to NZ and wants her sewing machine back...
Fabrics, piping, thread, etc. = c.$60
Cushion inners = $30
My sanity while learning to quilt = priceless

Project 3: The worm tower


Installing the worms - bleurgh!


Actually, I can't take credit for this one.  But I have watched enthusiastically as my ex-biologist boyfriend has brought it to fruition.  It all started with Ranui Community Garden and Ben Cheah's passion as he told us about all the good worms can bring to your garden when you put worm towers in.
This is a little different than an above-ground worm farm - the tower is part buried in the soil and the worms are free to come and go through large holes.  It's a lot more difficult to get the "products" of worm-farming with this method - the casts and tea tend to end up going into the soil or are only gathered periodically.
However, it's practically free to create and they process all your compostable waste for you whilst also improving your soil - not bad, eh?
We're waiting to see if we've got it right - if the worms are happy, they'll stay!
Buckets = $5
Worms = gift of Ranui Community Garden
Garden fork to get through the solid clay which passes for soil around here = $11
Old egg cartons etc for bedding = free!

Project 4: a bit of greenery


Life needs a bit more pistachio green, don't you think?
My walls were bare, I needed some cheering up and fast!  Luckily Ikea came to the rescue.  I started with some cheap-as pine frames and then added green paint, green silk, some flowery green cotton, sponges, beeswax and a fair bit of PVA glue.  Ta dah!
It also helped that the nearby dollar store was having a closing down sale (Headline: Sue takes Ulster thriftiness to new levels - waiting til the dollar store is closing down before making her purchase...) and was selling beautiful green mounts at 60 cents each.  Bargain!
Frames and clock = c.$40
Printing my fave photos / maps / etc. = c.$4
Mounts and paint = c.$5
Everything else = scrounged!

Disclaimer
Before you think I'm superwoman / a liar, I didn't achieve all of these in one weekend!  The worm tower and the planter are probably feasible one-day projects.  The cushions I wouldn't recommend to anyone who has a full time job!

Which is your favourite project?

Sunday, April 10, 2011

A week of discovery

  1. You don’t have to spend a fortune to start backyard beekeeping.
  2. Marua (Maah-rua) Road, Ellerslie.  What a great street.  My new favourite lunch spot, my new favourite food store and a second hand bookshop all in a few hundred metres.
  3. Mexican Specialities – cafe and Mexican importer – YUUUMMM!
  4. Asian food wholesaler / retailer: Shaji’s Spices.  These guys have every kind of seed, pulse and spice under the sun, at great prices and they’re just passionate about their food.  And they get five deliveries of fresh Indian bread a day.  Five.  How cool is that?
  5. Auckland’s iconic Sky Tower has (thick) glass panels in the floor of the observation deck so you can walk over hundreds of metres of thin air.  Which might have been a problem for me if I hadn’t already discovered...
  6.  I can overcome my fear of heights.  Tree Adventures.  Fun and sore arms.
  7. Auckland Council gives 2 hours worth of consultation free about improving the energy efficiency and healthiness of your home.  And then EECA give grants for things like insulation materials and workmanship.  But we all knew that already, right?
  8. Wool insulation just isn’t as good as fibreglass, inch for inch.  L
  9. A great Italian pizzeria in central Auckland.  Real pizza.  At last.  Thank goodness.  These guys are super friendly too.
  10.  Medievo: an Age-of-Empires-esque computer game which I can play within my browser.  That could cause much distraction...

Sunday, January 16, 2011

Visualize this: Where the public gets its news

I should say, where the US public gets its news.  And US public opinion does seem to affect us all, especially when presidents are elected...
The interesting thing is that it's changing.
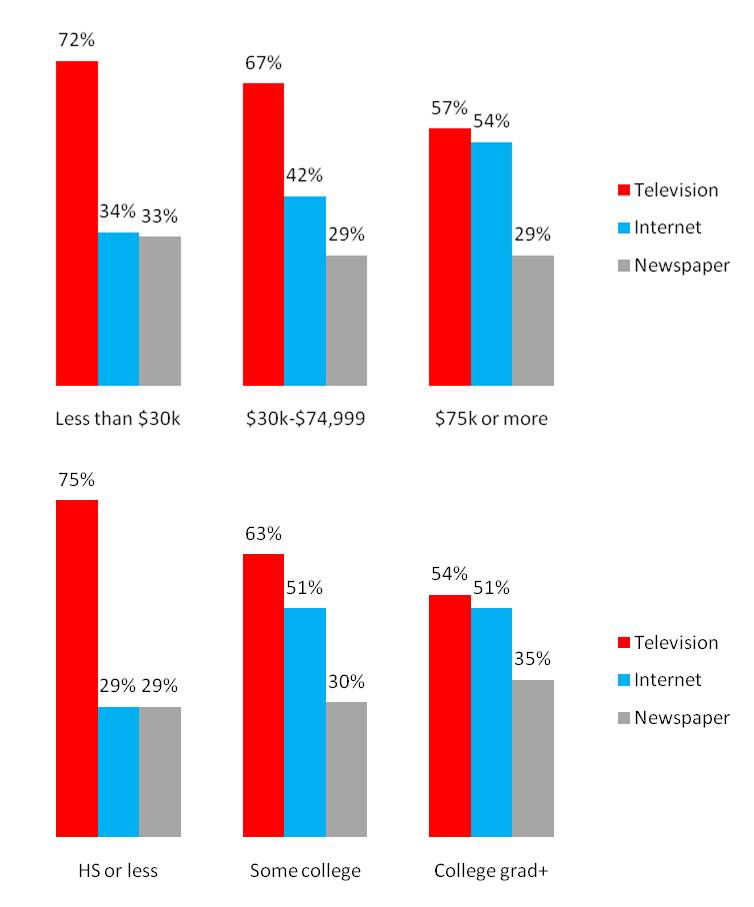
The Pew Research Center asks people every year, "How do you get most of your news about national and international issues?"  The latest release shows that for some demographics at least, internet news is at least as important as TV.  Even overall, it's not looking good for traditional media.
The solid line here is a trendline (statistically significant regression) of the actual data points.  Data were collected at uneven intervals, so I've taken that into account in my visualisation.
You'll also notice some coloured crosses - these relate to news sources for specific events.  Pew asked people "How do you get most of your news about the war in Iraq / Hurricane Katrina / the terrorist attacks (9/11)?"  We could argue that people's recall of their main news source is likely to be more accurate when linked to a specific past behaviour, such as following a particular story in the news, rather than news consumption in general.  Interestingly, TV news is relatively more important, and other sources are relatively less so, when asked about these specific events.  It would be interesting to see this kind of measure for the current decade.


The effect you see in the chart of internet news gobbling up newspaper readership and to a lesser degree TV viewing is amplified for younger groups, as can be seen on P3 of the original report.
As you might expect, there's also a socio-economic trend in the data: richer, more educated people are less likely to consider TV news and more likely to consider internet news as a main source.  When we remember that people were prompted to give up to two sources, this is fairly damning for TV news broadcasters.

Source: PEW RESEARCH CENTER.
Figures add to more than 100% because respondents could volunteer up to two main sources.
Last but not least, it's interesting to see the differences by region.  Here I was interested to see if the regions were very similar in their consumption of each medium, or if certain media are more popular in some areas than others.  With that in mind I show the degree above (green) or below (red) average each region is.  You can see the internet taking over from TV effect is most obvious in the west, but it's also interesting to see the preference for print media in the north-east, and to a lesser degree, for radio in the west.
Source: PEW RESEARCH CENTER.
Figures add to more than 100% because respondents could volunteer up to two main sources.
Thanks to Flowing Data for throwing down the challenge to improve on Pew Research's original graphics.

PS Word of warning to anyone who likes coxcomb (polar area) charts as much as I do: sometimes they just don't work so well... Doh!

Saturday, January 15, 2011

How to start in Farmville

In writing this, I know I'm revealing that (a) I waste time playing a two-dimensional, unrealistic and highly commercial game like Farmville and (b) I'm geeky enough to run the numbers to see how to crack it.  Ah well.  I rest safe in the knowledge that if you're reading this, you'll make a mental note of the solutions below in case you ever play yourself.
You can waste a lot of time making coins very slowly in Farmville, so I decided to see which crops would work out best in the long run.
Some assumptions:

  • You've started recently.  Not all crops are available, and you have a 12 x 12 square plot.
  • You don't want to spend real money on Farmville.
  • I've assumed you're playing for coins and to some degree XP, not mastery.  Mastery will come if you focus on specific crops anyhow.
  • I've assumed that you return to the game as soon as your crops are ready and start them going again instantly.  Of course, no one would really get up in the middle of the night to harvest their strawberries, would they?
  • I've looked at the first 8 weeks of your crop - that assumes you don't die of boredom in the meantime. This seemed a good length of time to let economies of scale play out.
  • I've taken into account the fact that space is limited (so a dense crop will make more money than a sparse one, all else being equal).
  • I've taken into account that you have to buy vegetables and pay to plow the land for each harvest; whilst for trees and animals you buy them once and they just keep on giving.
  • I haven't included any extra help (e.g. aborists, tractors, gifts), or limited time items.
We'd like to be in the top right of the chart below - crops that give you high profits and high XP.  This chart shows how much of each we've gained after 8 weeks of planting only that crop in our 12 x 12 plot.  But those crops outlined in blue would require a huge amount of dedication - returning to the game every four hours in the case of blueberries.
The green dots on the other hand, require a visit of once a day or less, and are still fairly profitable.  I recommend these.  Stick to trees if you really don't want to put too much effort in.


Let's look at the trends for profitability.  On the chart below you can see the different types of crop over the first 8 weeks of planting only that crop on your whole plot as often as you can.  Again, the blueberries etc. stand out as being profitable, but we're not interested in dedicating our lives to Farmville so let's look at the best of the rest.  Peppermint is the best of the non-perennial crops.  But by week 8, trees are starting to overtake.  They require a big initial outlay, but you can see it's going to pay off.  Lime has the steepest line - that means it'll be the most profitable in the long run.
What about animals?  Well, they look cute and you can fit four in a square.  But the only one you'll be able to buy when you begin is a sheep (I'm not counting limited time items).  It hasn't even paid for itself by week 8, so I wouldn't recommend it.


This is a beginner's view of the game - and I'm not sure how much longer I'm going to persist with Farmville.  Do let me know in the comments below if I'm missing the point somehow.

Friday, January 7, 2011

A measure of mugg

Pondering the mugginess which has descended upon Auckland like a Fury...

The delightful Bob McDavitt of NZ's Met Service clarifies a few things for me via his blog:
Bob McDavitt's illustration
  • Mugginess has it's upsides.  Pohutakawa trees enjoy it and flower more.
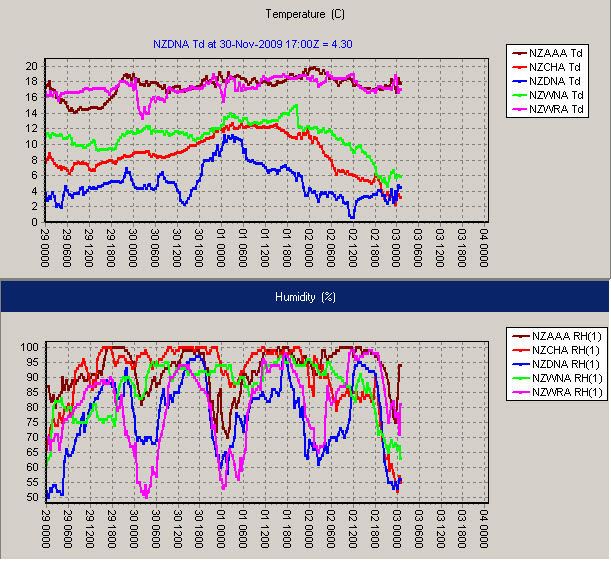
  • Humidity is not a good metric for mugginess.  100% humidity tells us that the air is holding as much water as it can (it's saturated), but the actual amount of water this is depends on factors like temperature and pressure.  In fact, the 100% humidity we're now enjoying in Auckland is also experienced from time to time in Dunedin, at the bottom of the South Island, but doesn't feel half so bad there.
  • "The air feels muggy when we get hot and sticky – and that’s when 1) the air is warm enough to make us perspire, and 2) the air contains sufficient water vapour to interfere with the evaporation of our perspiration and not allow us to cool down much from that.  So mugginess depends on both heat and humidity."  
Mugginess is better expressed by a meteorological concept called the dew point - which is the temperature at which water condenses onto a surface (it only happens at 100% humidity).
All this gave me two ideas.  
  1. Wouldn't it be nice to demonstrate the "mugginess point" via a scatterplot of temperature and humidity rather than Bob's slightly crummy charts (sorry Bob)?
  2. This time series dataset is a perfect opportunity for me to try out Google Docs' motion chart gadget - a freely available bubble chart which is animated over time.  
Lots of these kind of charting tools are available as commercial software, but I neither want to lock myself into one software package (and deal with compatibility issues etc.) or work with something which is completely closed source and not modifiable in all the ways I'd like.
What I came up with is nice.  Not perfect yet (for explaining mugginess at least!) but kinda fun and a good first step on my road to animated charts.

Note: press play at the bottom to see the time series.  The speed gauge is immediately to the right of the play button.  Dates are in US format.  Dew point is colour, and the two series are Auckland (right) and Wellington (left).  Have a play.

Monday, January 3, 2011

Cat adoration society photos

For no better reason than I'm on holiday and can blog my heart out, and that kitty is looking adorable...

New year, new look blog

Out with the old, in with the new!  While Ross spring-cleaned the house, I decided to refresh the blog.  (Stop feeling sorry for him, it was his turn.)
My aim is something more aspirational, which better reflects the things I love and care about.  Or in other words, I want to think about nature more than buildings!
Over the coming months, I hope to share the ongoing delight of harvests and all the yummy things I do with what I've grown, as well as more adventures in the great Nyuh Zilan and beyond.
Let me know what you like and dislike about the refit using the poll and the comment box below.


Sunday, January 2, 2011

Resolve

I resolve...
To give people the benefit of the doubt,
when my patience is thin and time's running out.
To find a cure for itchy bites,
to keep the cat medicated for fleas and mites.
To climb a mountain, at least just the one,
to indulge myself less and get more done.
To be more efficient in how things are run,
to be ordered and timely and not jump the gun.
To cook fifty new dishes, at least one a week,
using more parsley and cabbage and leek,
To buy new handbags and high heels,
to dress smarter for meetings and restaurant meals.
To enjoy the moment, spend more time with friends,
to make the most of the present before it ends.
In short I'll do everything I ought to do,
And be calm and grateful and tolerant too,
At least until March when the rain starts to fall,
By then I intend to have forgotten it all!

New Year's Day camping under Mount Taranaki

Saturday, December 25, 2010

Christmas is over

I survived Christmas.  Barely.  It's at times like these that I'm grateful to be in New Zealand.  Not only does the glorious sunshine provide a boost to the spirits through the pain of Christmas, but we also get to finish Christmas sooner than everyone else.
Something about the Jolly Season's unsubtle attempts to tug at heartstrings just leaves me feeling edgy.  Perhaps compounded by the way it highlights my inadequacies in the family/community department.  The "being with friends and family" aspects of Christmas remind me of how fragile my own safety net is, especially here on the far side of the world.  And as for being around children...
I'm not sure which disturbs me most - the children, or my own lack of empathy for them.  Will I ever make a good parent if children just annoy me?  Why do I even want to?
So all in all I'm glad the season for uncomfortable introspection is ending.  As a tonic, I ducked out of the Boxing Day seaside trip (with kids; I wouldn't have been allowed if Ross hadn't realised how depressed Christmas makes me) and stayed in my veggie garden to harvest parsley.  It's my third batch and I've no idea what I'm going to do with it all, but I still delight in its pungent greenness. 
I suppose it's time for New Year's Resolutions.  Having been indoctrinated in the SMART objectives ideology of 90s businesses, I may have to give this some thought.  Six days to work it out.  Any suggestions to the comment box below please!  (And any parsley recipes gratefully received too!)


Wednesday, November 17, 2010

Kitopatra

Just to prove I'm not lying when I told everyone how gorgeous my kitty is... Here's a nice shot of his Cleopatra style eyeliner.  Good thing too.  I wouldn't clean up cat poo for anyone less.

Saturday, November 13, 2010

Birthday Boy

Ross with his birthday present

Enjoying a relaxing family birthday for Ross' coming of age (33 is coming of age in hobbit years).