Friday, January 4, 2013

Exporting talent: the Rugby World Cup players

I'm uploading a few old but interesting Rugby World Cup visualisations...

National pride in sport

I'm intrigued by the idea of sports players acting like avatars for the people of a region or country, representing them in competitions with other regions. But what if the player is very evidently not from that region or country?
A large number of Rugby World Cup 2011 players 'migrated' to play for another country in the championship. 

How to read this chart:
At the left are the countries which players played for. At the right are the countries where they were born. The width of the ribbons shows how many players moved between those two countries.

  • New Zealand appears as the biggest exporter of talent. There are large numbers of Pacific Islander players living in New Zealand who returned to their ancestral home to play - Samoa is highly visible.
  • Samoa, the USA and Italy are the biggest importers of talent. Samoan players are generally ethnic Samoans from families living in New Zealand. Italy had several ethnic Italians from Argentina. The USA's figures are inflated by American Samoa players, who are considered to be 'migrated', but it still imported seven other players born around the globe.
  • A famous migrant is Quade Cooper, the New Zealand-born Australian player, who was booed in New Zealand RWC games. Quade's success was particularly resented because it worked against his birthplace.
  • Many of the migrated players, like Quade, moved early in life to their adopted countries. But for others, citizenship will have been planned in time for the RWC. Zimbabwean Tendai 'Beast' Mtawarira has had challenges with eligibility to play for South Africa, luckily resolved in time for RWC 2011.
  • It's easy to understand the inflow from countries with little chance of participating. On the other hand, several participating countries have both an inflow and an outflow of players - most notably there is cross-flow between New Zealand and the Pacific Islands, but note also England and South Africa.
  • Blips in the data - the structure of the UK makes for interesting analysis. Both the UK and its constituent parts (Scotland, England, etc.) are considered countries. However, Northern Irish players play for a pan-Ireland team, regardless of citizenship (this makes for an interesting challenge of what to play when it's time for the national anthem!). The Northern Irish players are shown here as 'migrated' when, in fact, they are playing for their team: Ireland.

Technical details: I created this chart in javascript library Protovis.

Sunday, October 21, 2012

October windiest since cyclone year

People around New Zealand are being blasted by the windiest October in decades. 

October the windiest month

October is when New Zealand has most wind. In Auckland, the average windspeed is 12.3 metres per second through the year, but that reaches a peak of 13.4 metres per second in October.

Powerful source of historical data

New Zealand's many weather stations have recorded temperature, rain, gales and other weather phenomena since the mid-1800s. This rich source of data allows us to see changes in weather patterns over time.
New Zealand's many weather stations (grey) and, highlighted in red, the four stations examined below

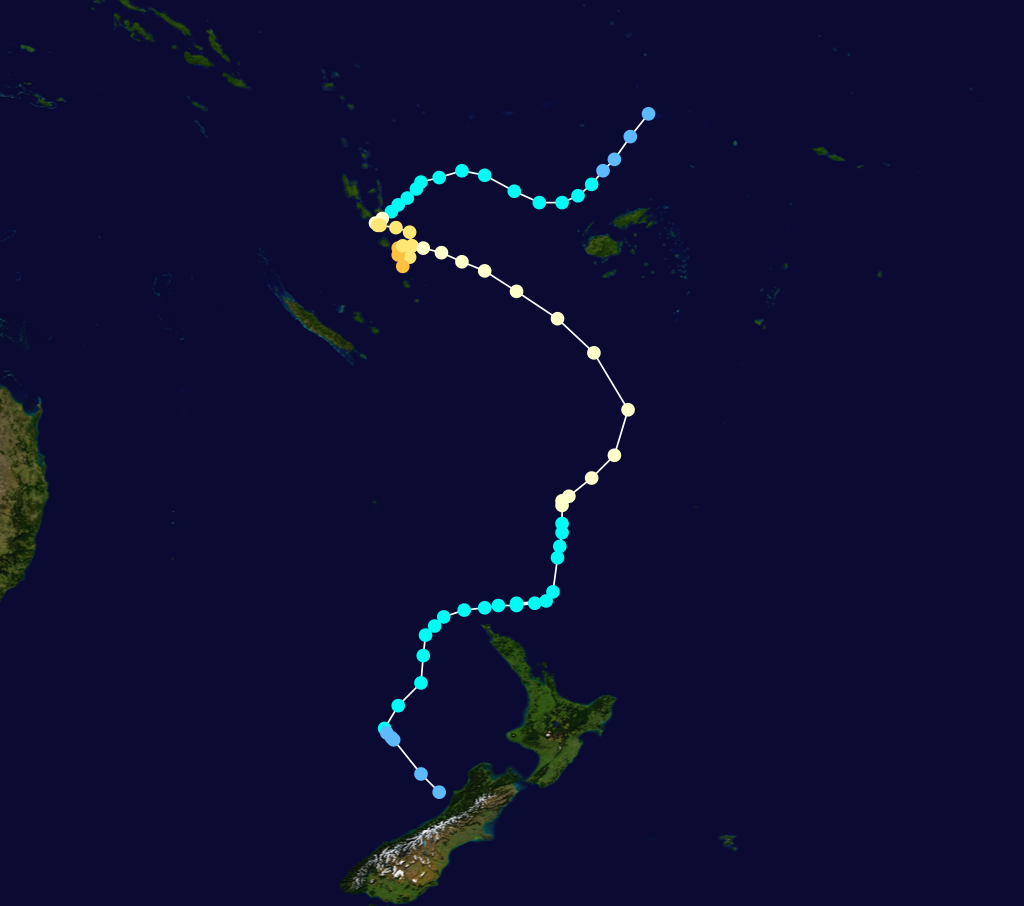
1988: the year of Cyclone Bola

1988 stands out as a record year across New Zealand in terms of wind. That year, both Wellington and Invercargill had over 30 days of gales! Although the cyclone was in February and March 1988, October 1988 was still much windier than normal.

The path of Cyclone Bola

Record windspeeds recorded in this October in Auckland

The average windspeed at Auckland airport is 13.4 metres per second, but this October to date (up to 18th October) has averaged a whopping 16.7 metres per second. So if you've felt blown about - now you know why!

Blustery October in Christchurch, Wellington and Invercargill

This October has also been more than a little breezy in the rest of the country, but not the windiest on record.

Christchurch's windiest Octobers in 40 years of records:
  1. 1988 (17.4 m/s windspeed)
  2. 2007
  3. 1984
Wellington's windiest Octobers in 40 years of records:
  1. 1988 (25.5 m/s windspeed)
  2. 1991
  3. 1984
Invercargill's windiest Octobers in 40 years of records:
  1. 1988 (21.6 m/s windspeed)
  2. 1977
  3. 2008


Friday, September 7, 2012

New Zealand's Rollin Hard: infographic about drugs

I've been catching up on news and stats published while I was in Italy and I'm amazed that there wasn't more local news coverage of the United Nations' World Drug Report. This shows New Zealanders to be among the most prevalent illegal drug users in the world!


I'm belatedly making up for the shortage with my own analysis - pretty sobering stuff, eh? For more details on my methods, or just to tell me what you think, drop me a line.


Friday, February 17, 2012

What I learnt today

I LOVE learning stuff. And I've learnt a lot recently, which makes me happy.

A month ago I was inspired by Google's Matt Cutts who advocates trying something new for thirty days.  My 'something' was An App a Day.

I didn't make it through the thirty days (thank you to the clients who've given me plenty of work to keep me out of mischief!), but I did learn tonnes.  In fact, it feels like a tiny pebble rolling has started an avalanche - so many exciting avenues of discovery, so little time!

Documenting all my new ideas is not my strong point, but here goes.

I've been thinking of moving Babbling Wren onto a more single-minded platform dedicated to data viz, and thinking about how that site will look, feel and function is a lot of fun.  I get geekily excited when I see sites like Fuzzimo and Rivers End which have some beautifully textured, interactive elements.  I want my site to appeal to the senses too.  With that in mind, I've been looking at effects which evoke old worn, noisy, rough, scuffed surfaces.  Things which remind you of the textures of your childhood, or how it feels to pick up a paintbrush or a needle and thread.

Appliquéd letters seemed like a good place to start.  So today I developed my fledgling Illustrator skills thanks to a couple of Vectips tutorials.


The nice thing about this is that I can save the style in Illustrator and apply it to any text, with any typeface.  Clever, no?

Saturday, December 31, 2011

Trees Worth Knowing About

An infographic comparing the wise old men of the tree world. 
Detail of illustration of the world's oldest tree.
Detail of infographic
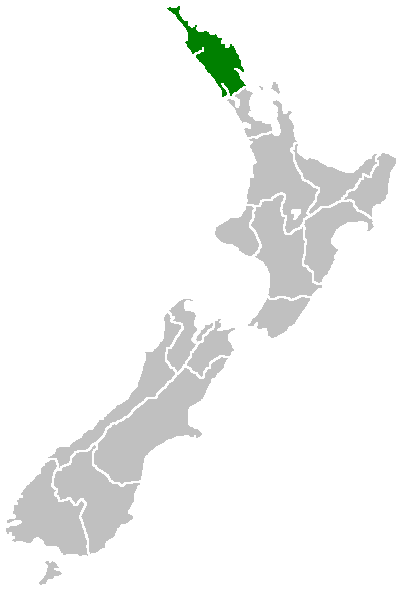
I spent my antipodean Christmas break in Northland - the remote and sparsely populated top chunk of NZ's North Island. I was delighted to discover not just gorgeous scenery but also some cultural gems there. 
Northland, New Zealand

Northland was a crucible of modern New Zealand; here the Declaration of Independence was signed, soon superseded by the controversial Treaty of Waitangi. Here Busby, Hobson, Clendon and Hone Heke battled to protect their interests with flags, contracts, and fire power. And here lives something more timeless than all of those famous warriors and diplomats: Tāne Mahuta, an ancient kauri tree and one of the oldest and largest living things on earth.


Seeing the virgin kauri forest is a moving experience. There is the smell of wet rainforest and the sound of a million tiny creatures fighting their corner of the ecosystem. A giant kauri is not only incomprehensibly vast, it is also smooth, with just a chaotic, spiky crown high above the ground. The towering giant gives an impression of serenity, but it is not thanks to a peaceful nature that kauri have survived since the Jurassic. They have five clever strategies to kick the young upstarts in the shins.

1.Bigger than the rest
Crown higher than canopy.
2.Unclimbable
Sheds lower branches as it grows, avoiding vines.
3.Shed skin to stay bug-free
Flaking bark defends from parasites.
4.Chemical warfare
Acidic litter from bark around base of tree releases other nutrients from clay, stopping other trees from getting them.
5.Scare off the bad bugs, share with the good ones
Acidity, waxes and phenols deter microorganisms which would otherwise rot the kauri, but symbiotic relationship with fungus mycorrhiza helps nutrient uptake, starving competitors.

Before my visit to Waipoua Forest, I was determined not to become a 'tree geek', but I'm afraid it's too late.  I'm in love with Tāne Mahuta and his contemporaries, and I thoroughly recommend you visit Northland.

Saturday, December 3, 2011

The 1376 Census of Sulmona (& Protovis Donut Chart)

Donut Chart
Data viz people love censuses.  They are a mirror for our nations to reflect upon ourselves.  There are lots of modern data viz examples using census data.  But no one seems to have analysed historic censuses.

Some of the earliest censuses which survive today began appearing in the 1200s and 1300s.  I've been enjoying Joseph & Frances Gies book, which explores what these early sources tell us about family life in the Middle Ages.  Since I used to live near Sulmona in central Italy, I had read about the rare Sulmona census of 1376 in Ezio Mattiocco's book.  Signore Mattiocco uses text, and the odd table, to explain the data.  Wouldn't it be great to see some of that visually?

The Gies don't mention the 1376 Sulmona census, so I thought I'd apply some of their analytic approaches to it in my data visualisation exploration.  

To get us started, here's a view of what land was used for in 1376.  The majority was ploughed, but a surprising amount is allocated to wine and hemp.


I created this chart in JavaScript / Protovis, but Blogger doesn't appear to support Protovis, so here's a static image instead.  In the original you can roll over each wedge to see the number of hectares represented.  Thanks to Nathan Yau's Visualize This for the tutorial.